Attack Detection and Blocking Troubleshooting
Attacks are not displayed
If attacks are not displayed the Cloud and the gauge-export_drops_flag metric gets the 1 value, this means the uploading of attacks from the node to the Cloud has stopped. Follow the steps to check and and fix this:
-
Make sure that the filtering node mode is different from
off. The node does not process incoming traffic in theoffmode.The
offmode is a common reason for thewallarm-statusmetrics not to increase. -
If the node is NGINX-based, restart NGINX to be sure that settings have been applied:
-
Check whether the script for uploading data to the analytical cluster has been run:
-
If the process is not running, start the
supervisordservice. -
Make sure in the
/opt/wallarm/etc/supervisord.confor/opt/wallarm/etc/supervisord.conf.postanalyticsthewcliscript is configured properly (mode is should be NOT specified - by default it isallor should be-mode post_analytic). -
Check logs:
-
Check whether the
wallarmandtarantoolservices are running: -
If it is not, run it:
-
If this did not help, check
IP:porton whichtarantoolis running in the/opt/wallarm/env.listfile, section #tarantool,HOSTandPORTparameters. Set:HOST=127.0.0.1PORT=3313
If the postanalytics module is installed at a separate server, check and configure the same data in
/opt/wallarm/etc/wallarm/node.yaml. -
Restart the wallarm service:
-
If this did not help, check request timeouts in
wcli-out.log: -
If request timeout errors are presented, check the availability of Wallarm's API, grant access to it, it it is not granted yet.
-
If some other errors are presented in
wcli-out.log, contact the Wallarm support team.
Some attacks are not displayed
If some attacks are not displayed the Cloud and the gauge-export_drops_flag metric gets the 1 value, this means that requests with attacks have been deleted from the postanalytics module but not sent to the Cloud. Usually this happens due to the insufficient memory allocated form the postanalytics module. Follow the steps to check and and fix this:
-
Check logs:
-
If there are errors in the log, act as described here.
-
If this did not help, check the
timeframe_sizemetric value:/opt/wallarm/usr/bin/collectdctl -s /opt/wallarm/var/run/wallarm-collectd-unixsock getval "$(/opt/wallarm/usr/bin/collectdctl -s /opt/wallarm/var/run/wallarm-collectd-unixsock listval | awk -F "/" '{ print $1 }' | head -n1)"/wallarm-tarantool/gauge-timeframe_sizeIf the value is < 300, in
/opt/wallarm/env.list, increase the value ofSLAB_ALLOC_ARENAand then restart thewallarmservice. -
If this did not help, check the
export_delaymetric value:/opt/wallarm/usr/bin/collectdctl -s /opt/wallarm/var/run/wallarm-collectd-unixsock getval "$(/opt/wallarm/usr/bin/collectdctl -s /opt/wallarm/var/run/wallarm-collectd-unixsock listval | awk -F "/" '{ print $1 }' | head -n1)"/wallarm-tarantool/gauge-export_delayIf the value is > 10, then check the stability of connection to Wallarm API.
-
Restart
wallarmandwcli:
Filtering node RPS and APS values are not exported to Cloud
If filtering node information about RPS (requests per second) and APS (attacks per second) are not exported to Wallarm cloud, the possible reason is SELinux.
SELinux is installed and enabled by default on RedHat‑based Linux distributions (e.g., CentOS or Amazon Linux 2.0.2021x and lower). SELinux can also be installed on other Linux distributions, such as Debian or Ubuntu.
Check SELinux presence and status by executing the following command:
If the SELinux mechanism is enabled on a host with a filtering node, during node installation or upgrade, the all-in-one installer performs its automatic configuration for the node not to interfere with it.
If after automatic configuration you still experience the problems that can be caused by SeLinux, do the following:
-
Temporarily disable SELinux by executing the
setenforce 0command.SELinux will be disabled until the next reboot.
-
Check whether the problem(s) disappeared.
-
Contact Wallarm's technical support for help.
SELinux permanent disabling not recommended
It is not recommended to disable SELinux permanently due to the security issues.
Filtering node does not block attacks when operating in blocking mode (wallarm_mode block)
Using the wallarm_mode directive is only one of several methods of traffic filtration mode configuration. Some of these configuration methods have a higher priority than the wallarm_mode directive value.
If you have configured blocking mode via wallarm_mode block but Wallarm filtering node does not block attacks, please ensure that filtration mode is not overridden using other configuration methods:
-
Using the rule Set filtration mode
More details on filtration mode configuration methods →
User gets blocking page after legitimate request
If your user reports a legitimate request being blocked despite the Wallarm measures, you can review and evaluate their requests as this articles explains.
To resolve the issue of a legitimate request being blocked by Wallarm, follow these steps:
-
Request the user to provide as text (not screenshot) the information related to the blocked request, which is one of the following:
-
Information provided by the Wallarm blocking page if it is configured (may include user’s IP address, request UUID and other pre-configured elements).
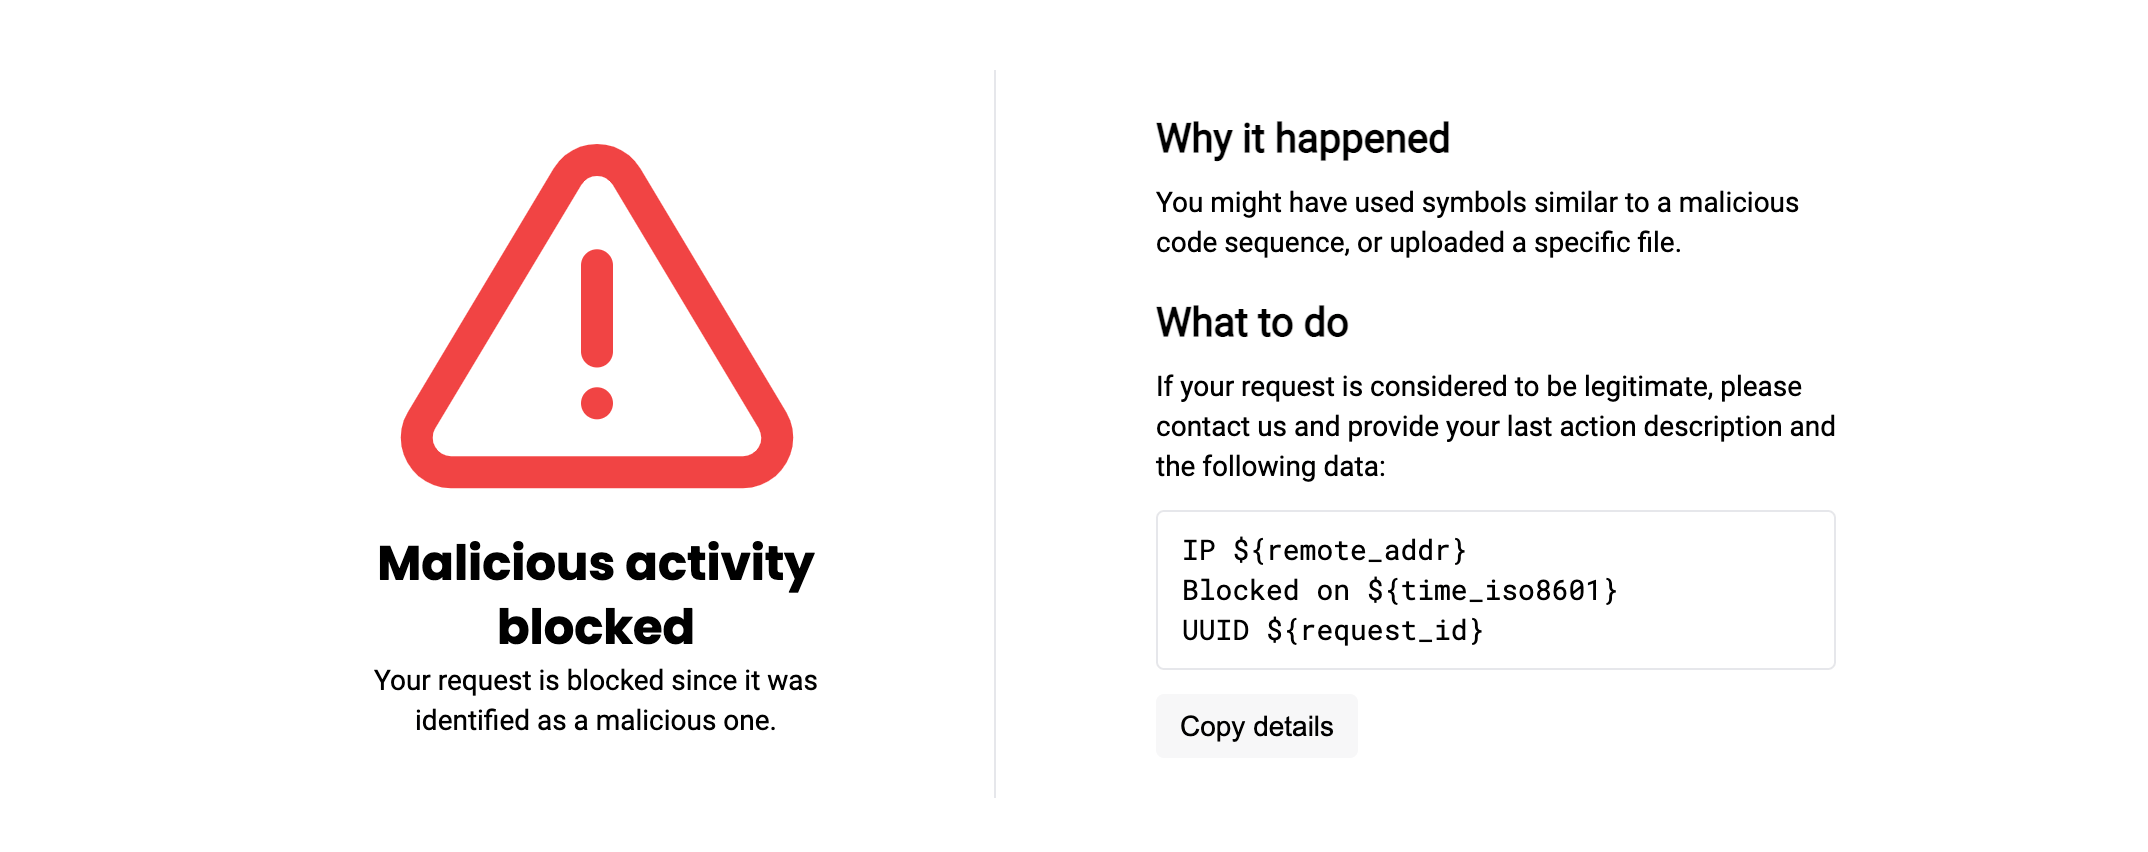
Blocking page usage
If you do not use the default or customized Wallarm blocking page, it is highly recommended to configure it to get the appropriate info from user. Remember that even a sample page collects and allows easy copying of meaningful information related to the blocked request. Additionally, you can customize or fully rebuild such page to return users the informative blocking message.
-
Copy of user's client request and response. Browser page source code or terminal client textual input and output suits well.
-
-
In Wallarm Console → Attacks or Incidents section, search for the event related to the blocked request. For example, search by request ID:
-
Examine the event to determine if it indicates a wrong or legitimate blocking.
-
If it is a wrong blocking, solve the issue by applying one or a combination of measures:
- Measures against false positives
- Re-configuring rules
- Re-configuring triggers
- Modifying IP lists
-
If the information initially provided by the user is incomplete or you are not sure about measures that can be safely applied, share the details with Wallarm support for further assistance and investigation.
Errors in postanalytics module
If the tnt_errors metric gets +1 at each processed request, this means some problems in Wallarm's postanalytics module functioning occur. Follow the steps to check and and fix this:
-
Check if
wallarm-tarantoolservice is running: -
If it is not running, run it:
-
Additionally, check the tarantool process managed by
supervisord: -
Restart tarantool:
-
If this did not solve the problem, proceed to the next steps.
-
Check
/opt/wallarm/var/log/wallarm/tarantool-out.log, if there are errors like "Index 'primary' already exists" or "can't initialize storage", delete all files from/opt/wallarm/var/lib/wallarm-tarantooland restart Wallarm: -
If this did not solve the problem, collect the debug information:
-
Create ticket in Wallarm support system, providing the collected information.
Filtering node not processing requests
If the segfaults metric gets value different from 0 and increases, there are problems with filtering node processing requests. Follow the steps to check and and fix this:
-
Check whether other filtering nodes (if any) work properly.
-
Restart nginx:
-
If this did not help, for the machine with problematic node, start collecting core files:
- Create folder to store core files
mkdir /tmp/cores/. -
Make sure NGINX can save files to the folder:
-
To
/etc/nginx/nginx.conf, add the strings: -
Restart NGINX.
- Create folder to store core files
-
If
segfaultscontinues to increase, collect core files, output ofdpkg -land files by the/var/log/nginx/*error*.logmask. -
If problem affects significantly the application normal functioning, set filtering node to the
offmode temporarily. -
Send the collected data to Wallarm support team.
-
Get a fix data from Wallarm support team.
-
Check NGINX configuration correctness with
nginx -t. -
Re-enable Wallarm node by setting mode different from
off. -
Restart NGINX.
Requests are not proxied to applications
If one of the following happens:
-
Requests reach filtering node but do not reach target applications
-
Filtering node does not process requests
This may mean problems with proxying requests from node to applications. Follow the steps to check and and fix this:
-
Check NGINX status and restart it if necessary:
-
If this did not help, check NGINX logs for incoming requests, if they are absent:
- Check connection between the load balancer and the node.
- Check the load balancer configuration.
-
If requests reach filtering node, but do not reach the target application, check connection between node and application.
-
If you have timeout errors, increase NGINX's
proxy_read_timeoutandproxy_connect_timeoutin/etc/nginx/nginx.conf.